Testing for Left Censorship
Robert M Flight and Hunter NB Moseley
Source:vignettes/testing-for-left-censorship.Rmd
testing-for-left-censorship.RmdWhy?
{ICIKendallTau} has a very specific assumption, that the missing values are largely due to being below the limit of detection, or the result of left-censorship. Therefore, it should only be used if the missing values are from left-censorship. Ideally, it would be nice to have a way to test for it.
Strategy
To test this, we do the following (implemented in
test_left_censorship). For any feature that is missing in
one or more samples in a class of samples, we check if the non-missing
entries are below their sample’s median values. We count all of the
entries below sample medians as successes, and the total number of
possible entries as the number of trials in a binomial test, aggregating
across all features that had a missing value. We can then perform a
one-tailed binomial test with the expectation that the successes are
greater than 0.5.
Fake Data
To start, we need to make some fake data that we can evaluate the test on. We will make a smallish dataset, with 1000 features across 20 samples, and we will have 80% of the missing values be due to being left-censored.
We sort the initial data so we know where we can easily put missingness due to left-censoring. We also use a log-normal distribution initially, just because.
set.seed(1234)
n_feature = 1000
n_sample = 20
n_miss = 100
n_low = 80
test_dataset = rlnorm(n_feature, 10, 1)
test_dataset = sort(test_dataset)

noisy_dataset = add_uniform_noise(log(test_dataset), n_sample, 0.1)
sample_medians = calculate_matrix_medians(noisy_dataset)
Add Missingness
Now we can sample some low and high indices to add our missingness, as well as some samples to add them to.
low_indices = sample(seq_len(300), n_low)
hi_indices = sample(seq(800, 1000), n_miss - n_low)

all_indices = c(low_indices, hi_indices)
sample_indices = sample(n_sample, n_miss, replace = TRUE)

missing_dataset = noisy_dataset
for (i_loc in seq_along(all_indices)) {
  missing_dataset[all_indices[i_loc], sample_indices[i_loc]] = NA
}
We can actually visualize the missingness using the
visdat package.
visdat::vis_miss(as.data.frame(missing_dataset))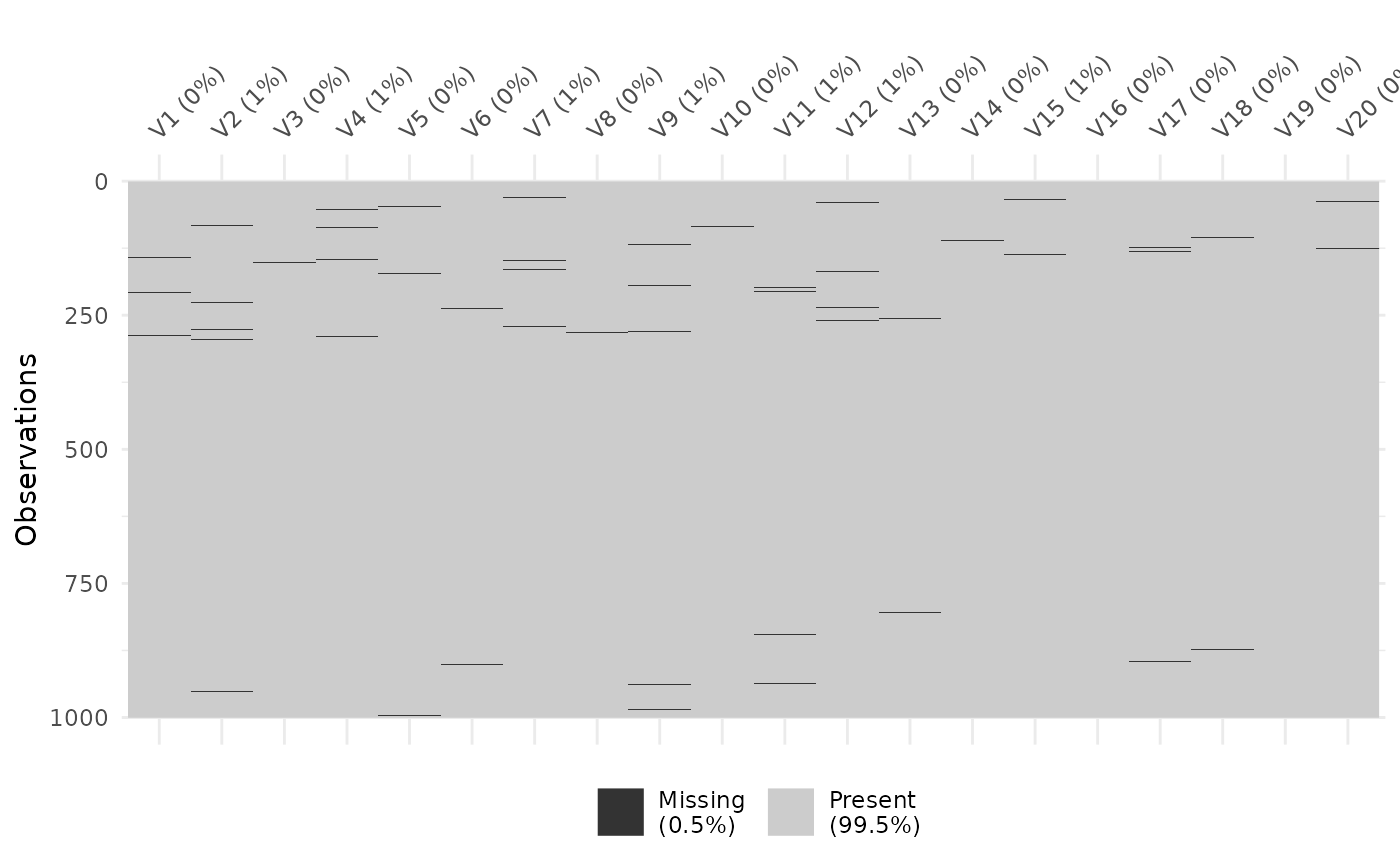
Missing entries in the test dataset.
Test
Now we can actually test the missingness entries.
missing_test = test_left_censorship(missing_dataset)
missing_test
#> $values
#>   trials success class
#> 1   1900    1520     A
#>
#> $binomial_test
#>
#>  Exact binomial test
#>
#> data:  total_success and total_trials
#> number of successes = 1520, number of trials = 1900, p-value < 2.2e-16
#> alternative hypothesis: true probability of success is greater than 0.5
#> 95 percent confidence interval:
#>  0.7843033 1.0000000
#> sample estimates:
#> probability of success
#>                    0.8
RNA-Seq Example
Gierliński et al (link) did a really neat experiment in yeast, with a large number of replicates, 48 WT and 48 SNF2 deletion mutant. We’ve included a summarized experiment as part of this package, and use it to demonstrate the left-censorship in a real data context.
yeast_stats = test_left_censorship(yeast_missing, sample_classes = yeast_classes)
yeast_stats
#> $values
#>   trials success class
#> 1  18336   18336  snf2
#> 2  20424   20424    wt
#>
#> $binomial_test
#>
#>  Exact binomial test
#>
#> data:  total_success and total_trials
#> number of successes = 38760, number of trials = 38760, p-value <
#> 2.2e-16
#> alternative hypothesis: true probability of success is greater than 0.5
#> 95 percent confidence interval:
#>  0.9999227 1.0000000
#> sample estimates:
#> probability of success
#>                      1
In addition to testing, we can re-order the features based on their median ranking across samples.
yeast_order = rank_order_data(yeast_missing, sample_classes = yeast_classes)
visdat::vis_miss(as.data.frame(yeast_order$wt$original))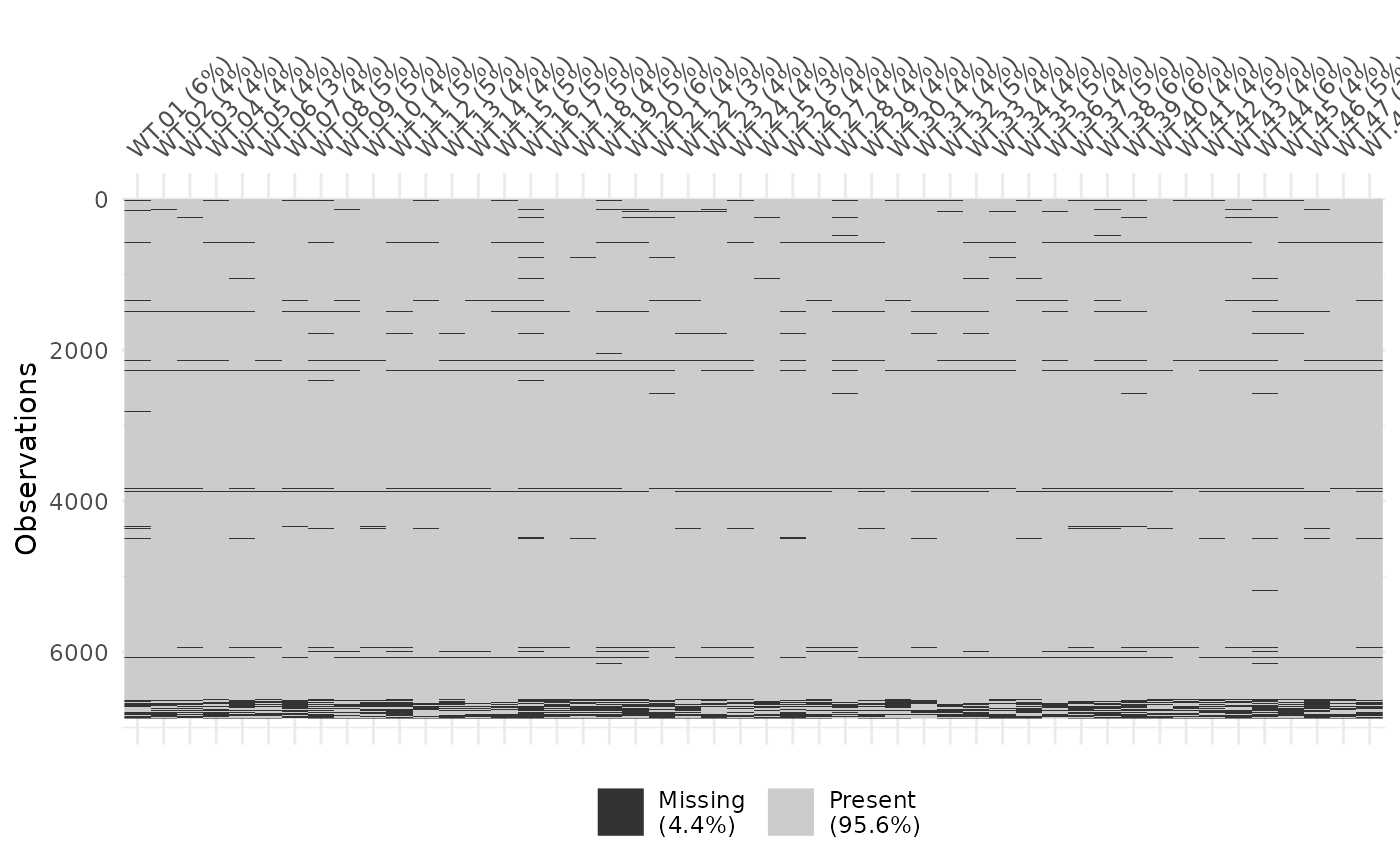
Missingness in yeast data set, no ordering.
visdat::vis_miss(as.data.frame(yeast_order$wt$ordered))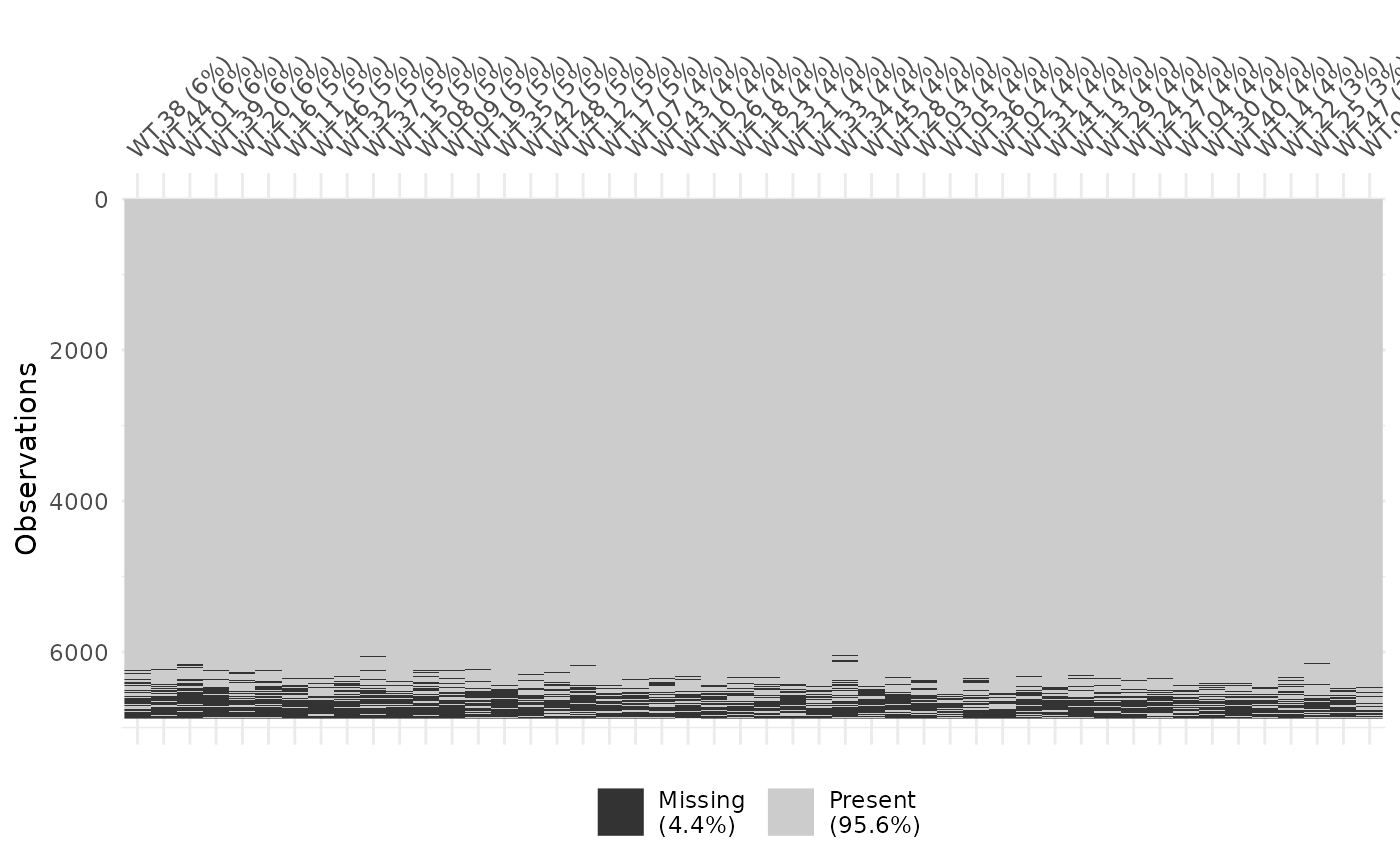
Missingness in yeast data set, after ordering features by rank.
yeast_n_na = dplyr::bind_rows(yeast_order$wt$n_na_rank,
                              yeast_order$snf2$n_na_rank)
yeast_n_na |>
  ggplot(aes(x = n_na, y = median_rank)) +
  geom_point(size = 0.1, position = "jitter") +
  facet_wrap(~ split, nrow = 1)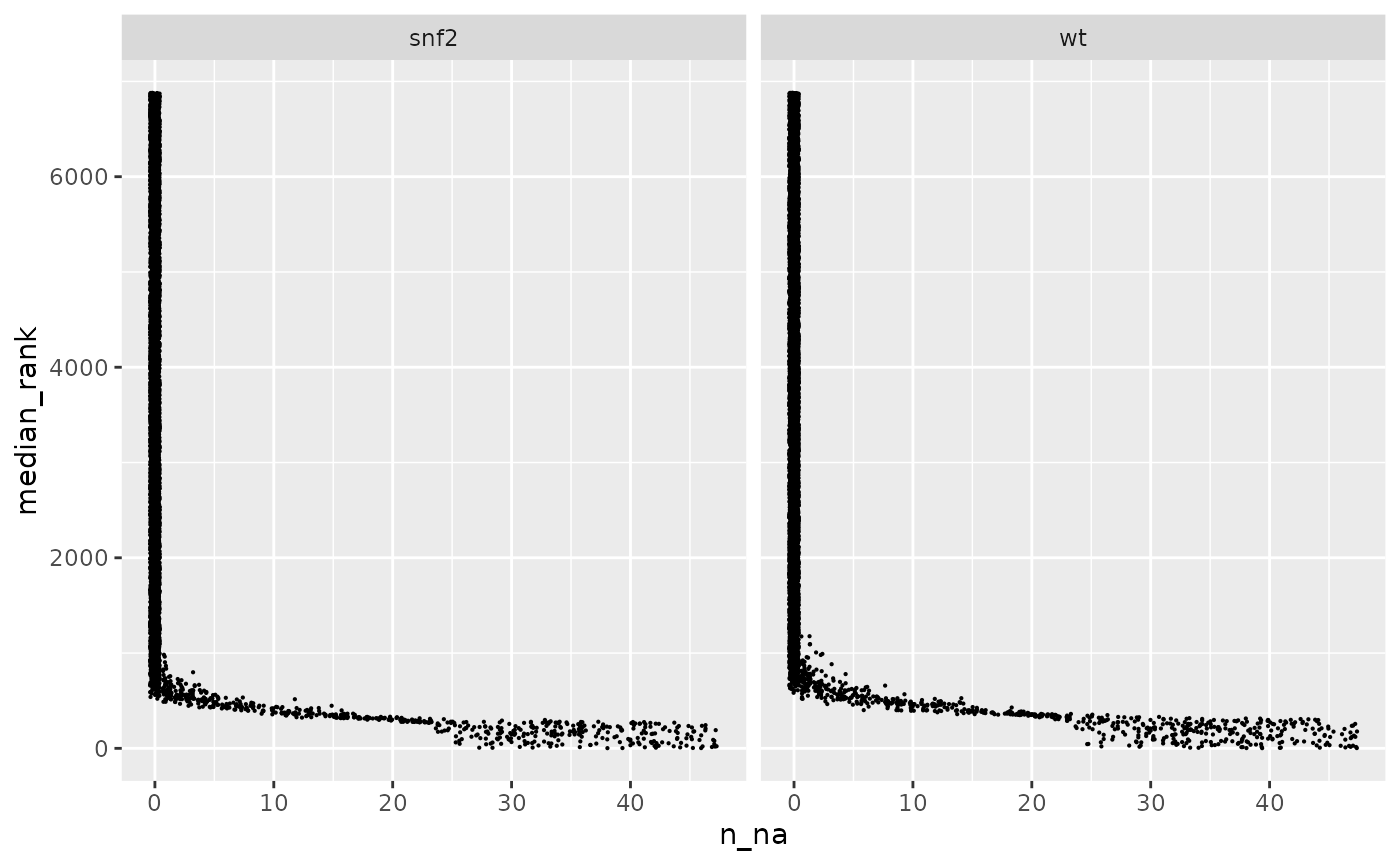
Feature rank as a function of the number of missing values.